Key points:
- Bitcoin tops $82,000
- Traders battle for dominance
- Prices hit fresh three-month top
OG coin tried to break above the 200-day line resistance for the second day in a row.
💵 Bitcoin Keeps Smacking Resistance
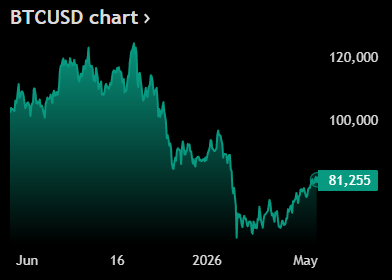
- Bitcoin BTCUSD made another run at its 200-day moving average near $82,000 — and once again got shoved back under it. Two attempts in two days, two rejections. The chart is starting to look personal.
- The 200-day moving average is one of the market’s favorite long-term trend gauges. Trading below it often signals bearish conditions, while a breakout above can flip sentiment toward a more bullish outlook.
- Bitcoin briefly tagged $82,000 early Monday before sliding back toward the $80,000 zone. That level is now shaping up as a major battleground between buyers trying to force a breakout and sellers defending resistance.
💰 ETF Flows Keep Supporting BTC
- Despite the rejection, the broader backdrop remains constructive. Spot Bitcoin ETFs pulled in roughly $620 million in net inflows last week, extending their up-only streak to six straight weeks. Institutional money is still showing up.
- Over that six-week stretch, spot Bitcoin ETFs attracted more than $3.4 billion in fresh capital. Translation: large investors continue buying Bitcoin exposure even while price action chops sideways.
- Quick jargon check: ETF inflows are a big thing because they often represent real spot demand. When funds buy Bitcoin-backed ETFs, actual Bitcoin typically needs to be purchased behind the scenes, tightening available supply.
🌍 Macro Chaos Meets Crypto Optimism
- Geopolitical tensions are muddying the picture. Weekend headlines around the US-Iran conflict rattled broader markets after Donald Trump rejected Iran’s latest peace proposal as “totally unacceptable.”
- Risk assets, including crypto, tend to react sharply to geopolitical uncertainty because traders suddenly reassess everything from inflation expectations to liquidity conditions. Bitcoin may be decentralized, but it still trades on Earth.
- Analysts remain deeply split on what comes next. Bulls see momentum and ETF demand eventually pushing BTC above $100,000. Bears argue failure at the 200-day average (or around it) could send prices back toward $50,000 — or even $40,000. For now, that moving average is the line everyone’s watching.
Source: Tradingview
No responses yet